
SMARVUS database of stats students and many of their feelings and cognitions about stats

You all. Many people, but mostly Jenny Terry and Andy Fields, but also a number of my Twitter mutuals, collected a crap ton of data from statistics students worldwide

See:

This large, international dataset contains survey responses from N = 12,570 students from 100 universities in 35 countries, collected in 21 languages. We measured anxieties (statistics, mathematics, test, trait, social interaction, performance, creativity, intolerance of uncertainty, and fear of negative evaluation), self-efficacy, persistence, and the cognitive reflection test, and collected demographics, previous mathematics grades, self-reported and official statistics grades, and statistics module details. Data reuse potential is broad, including testing links between anxieties and statistics/mathematics education factors, and examining instruments’ psychometric properties across different languages and contexts. Note that the pre-registration can be found here: https://osf.io/xs5wf.

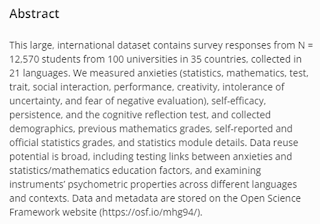
Here is the article describing the project. The data is embargoed until October 2024, but you can contact the corresponding authors if you would like early access. Also, they have tons and tons of documentation available at OSF. So you can come up with your own hypotheses and test them. Which is very, very generous.


Comments

Popular posts from this blog

Ways to use funny meme scales in your stats classes

Have you ever heard of the theory that there are multiple people worldwide thinking about the same novel thing at the same time? It is the multiple discovery hypothesis of invention . Like, multiple great minds around the world were working on calculus at the same time. Well, I think a bunch of super-duper psychology professors were all thinking about scale memes and pedagogy at the same time. Clearly, this is just as impressive as calculus. Who were some of these great minds? 1) Dr.  Molly Metz maintains a curated list of hilarious "How you doing?" scales.  2) Dr. Esther Lindenström posted about using these scales as student check-ins. 3) I was working on a blog post about using such scales to teach the basics of variables.  So, I decided to create a post about three ways to use these scales in your stats classes:  1) Teaching the basics of variables. 2) Nominal vs. ordinal scales.  3) Daily check-in with your students.  1. Teach your students the basics...

Using pulse rates to determine the scariest of scary movies

  The Science of Scare project, conducted by MoneySuperMarket.com, recorded heart rates in participants watching fifty horror movies to determine the scariest of scary movies. Below is a screenshot of the original variables and data for 12 of the 50 movies provided by MoneySuperMarket.com: https://www.moneysupermarket.com/broadband/features/science-of-scare/ https://www.moneysupermarket.com/broadband/features/science-of-scare/ Here is my version of the data in Excel format . It includes the original data plus four additional columns (so you can run more analyses on the data): -Year of Release -Rotten Tomato rating -Does this movie have a sequel (yes or no)? -Is this movie a sequel (yes or no)? Here are some ways you could use this in class: 1. Correlation : Rotten Tomato rating does not correlate with the overall scare score ( r = 0.13, p = 0.36).   2. Within-subject research design : Baseline, average, and maximum heart rates are reported for each film.   3. ...

If your students get the joke, they get statistics.

Gleaned from multiple sources (FB, Pinterest, Twitter, none of these belong to me, etc.). Remember, if your students can explain why a stats funny is funny, they are demonstrating statistical knowledge. I like to ask students to explain the humor in such examples for extra credit points (see below for an example from my FA14 final exam). Using xkcd.com for bonus points/assessing if students understand that correlation =/= causation What are the numerical thresholds for probability?  How does this refer to alpha? What type of error is being described, Type I or Type II? What measure of central tendency is being described? Dilbert: http://search.dilbert.com/comic/Kill%20Anyone Sampling, CLT http://foulmouthedbaker.com/2013/10/03/graphs-belong-on-cakes/ Because control vs. sample, standard deviations, normal curves. Also,"skewed" pun. If you go to the original website , the story behind this cakes has to do w...