
The thing about my way of teaching stats is that my cool, novel examples get old really fast. Like, pop culture is on a thirty-day cycle. Anyway, YEARS ago, 2014 to be exact, I blogged about illustrating bimodal data distributions using baby name data from the Social Security Administration. Specifically, when an older name comes back into vogue, it has a bimodal distribution when you plot time on the X axis. I stand by this example. However, all of the data illustrations come from 2014. When our traditionally aged college students were 6 or 7. Which makes this example feel a little stale. However, here is some data, courtesy of Redditor fevaah , showing old names that are back in vogue through 2025 ! And Eleanor, Violet, Nora, and Hazel are here, illustrating bimodal distributions for a new generation. If you used my old baby-name data, this is a quick, easy refresh for your lectures (or a fun new addition if you didn't). If this idea was help...
Hi, friends.
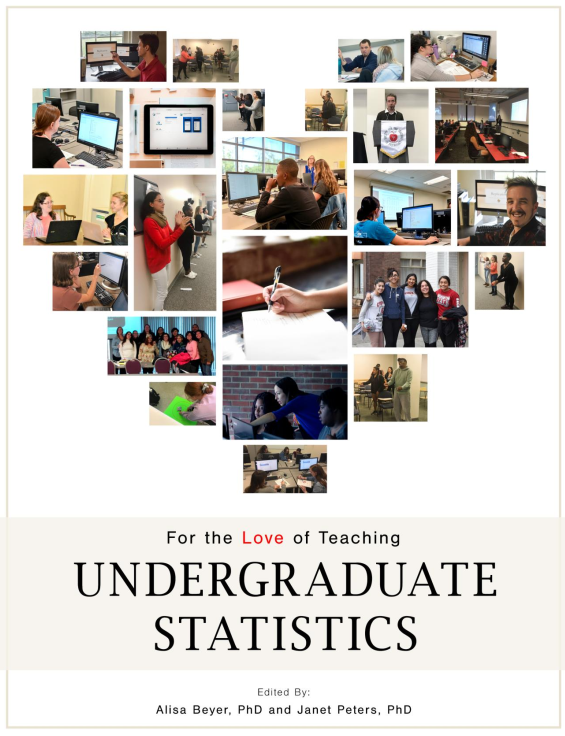
There is a free, new edited volume that contains 18 terrific chapters of ideas and hints and guidance for teaching undergraduate statistics. Drs. Beyer & Peters but so much work into gathering ideas from great teachers and now we can all enjoy it.
I wrote Chapter 1. In it, I make an argument that we need to teach statistics to our psychology UGs in a way that better matches how they will use the statistics. TL:DR: 4% of psychology UGs get PhDs in psychology. So maybe we should reconsider how and who we are teaching.