
Alright, kismet, coincidence, I don't know. Still, I'm noticing all of these recent and good scientific articles contain the types of statistical analyses we typically teach in Psych Stats.
Like this article:
Hatano, A., Ogulmus, C., Shigemasu, H., & Murayama, K. (2022). Thinking about thinking: People underestimate how enjoyable and engaging just waiting is. Journal of Experimental Psychology: General. Advance online publication. https://doi.org/10.1037/xge0001255
TL;DR: People think they won't enjoy being alone with their thoughts. BUT THEY DO, as the authors demonstrated throughout five experiments. And those experiments contained a bunch of t-tests (and open data). There are even a couple of ANOVAs in there.
This is a fine example of how to flesh out a hypothesis using a multi-study design. And it is a round-about way of making our students (and ourselves) reflect on how we feel about boredom, alone time, and technology.
It also contains some very effective data visualization (and also some effective tables):
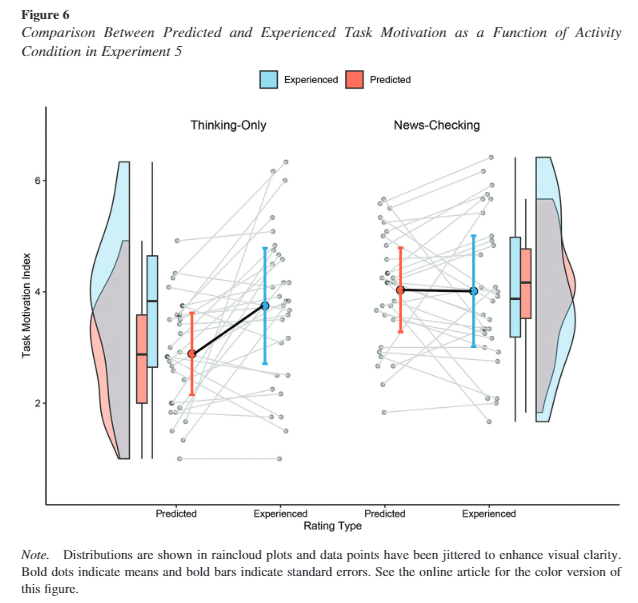 |
| Will you look at that? A simple research design, with a simple t-test, but visualized very well to demonstrate variability. I feel like these participant-by-participant level illustrations are more honest. |
 |
| Maybe data viz. isn't your thing, or what you are teaching a bunch of junior statisticians? No problem, there are also several great tables in this research. |