
Statistical literacy is important. I love examples of folks using statistical concepts without being snobby statistical gatekeepers. For instance, see jargon-free statistical literacy that helps people make important decisions about their children's health or informs the immigration debate . As stats teachers, I think we are remiss if we don't talk about political polling in our classes. At least a little bit. Here is a brief, nonpartisan interview about political polling you can use in class to see whether students can identify the concepts they've learned. Here is a short NPR i nterview o n how to think properly about political polling. If you use the interview in class, you could ask your students to identify the statistics and research methods mentioned. I clocked margin of error, sampling error, and research methodology evaluation. If using an audio interview isn't your thing, check out t his summary piece from NPR, based on the...
This headline is a good example of a) journalists misrepresenting statistics as well as b) confidence intervals/margin of error more broadly. See the headline below:
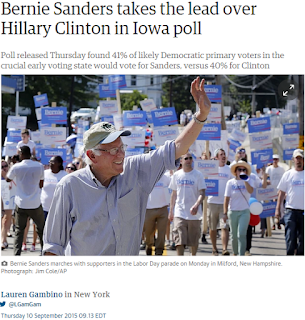

In actuality, Bernie didn't exactly take the lead over Hillary Clinton. Instead, a Quinnipiac poll showed that 41% of likely Democratic primary voters in Iowa indicated that they would vote for Sanders, while 40% reported that they would vote for Clinton.
If you go to the original Quinnipiac poll, you can read that the actual data has a margin of error of +/- 3.4%, which means that the candidates are running neck and neck. Which, I think, would have still been a compelling headline.
I used this as an example just last week to explain applied confidence intervals. I also used this as a round-about way of explaining how confidence intervals are now being used as an alternative/compliment to p-values.