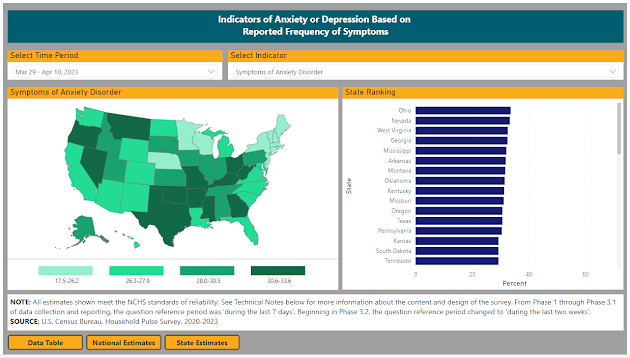
It shouldn't come as a shock that the CDC shares data on rates of public health issues in the US.
1. Teach your students a lesson about good sources for mental health data.
2. Show your students how data visualizations can help present and simplify complex data.
 |
| https://www.cdc.gov/nchs/covid19/pulse/mental-health.htm |
 |
| https://www.census.gov/data/experimental-data-products/household-pulse-survey.html |
4. Talk about how the government assesses depression and anxiety. For example, you can show how the basic methodology uses a valid, reliable measure of mental health.
 | |
|
5. You can also download the data, divided by demographic, here.
 |
| Even sad, anxious data makes me happy. |
It is a crap ton of data. You can sort it by state, age bracket, nationality, and sexual orientation...like, there are 12970 rows of data (which, btw, JASP could handle). Each row doesn't even represent a participant. Instead, it represents a different group and subgroup of data.
Phew.
I would use this data to show students how to sort through enormous data sets.

Comments
Post a Comment