
 |
| io9.com |
Das and Biller, reporting for io9.com, shared several good examples of bad graphs. The graphs are bad for a variety of reasons. I have highlighted a few below.
Non-traditional display of data that create the illusion that the opposite of the truth is true:
 |
| Note the y-axis is flipped (0 at the top...huh?), so murders have actually INCREASED since "Stand Your Ground". |

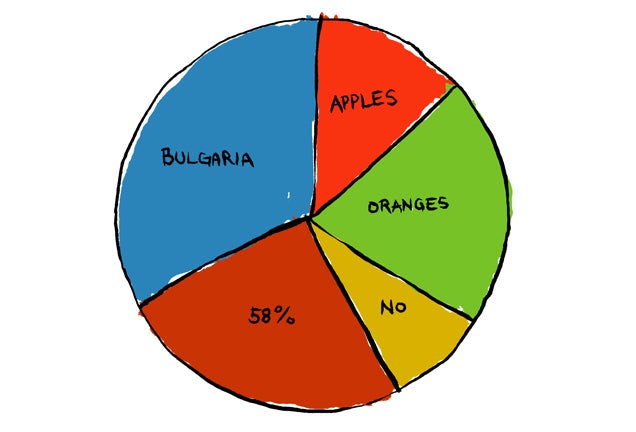
Confusing data presentation:

I think that this could be fun to use in class as a discussion piece to pick apart bad graphs, so that your students 1) think critically about all graphs and figures they see and 2) learn how to make truthful graphs. Another fun way to use this in class would be to present these graphs to your students and then ask them to create APA style manual compliant graphs of the same data.