I think this is a good first day of class example.
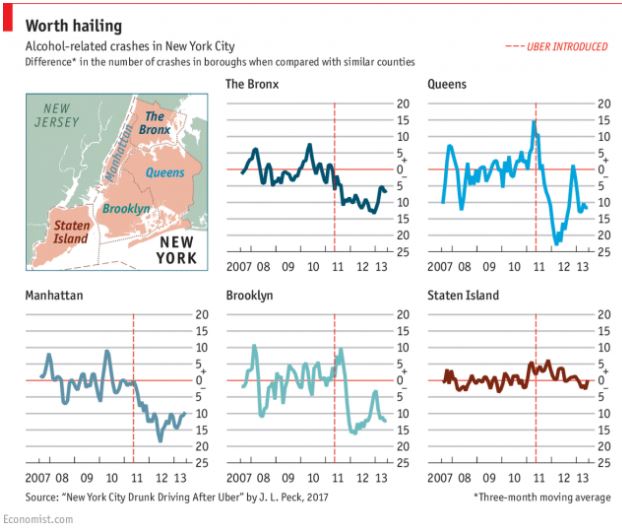
It shows how data can make a powerful argument, that argument can be persuasively illustrated via data visualization, AND, maybe, it is a soft sell of a way to keep your students from drunk driving. It also touches on issues of public health, criminal justice, and health psychology.
This article from The Economist succinctly illustrates the decrease in drunk driving incidents over time using graphs.
This article is based on a working paper by PhD student Jessica Lynn (name twin!) Peck.


Comments
Post a Comment