
I've shared these on my Twitter feed, and in a previous blog post dedicated to stats funnies. However, I decided it would be useful to have a dedicated, occasionally updated blog post devoted to Twitter Statistics Comedy Gold.
How to use in class? If your students get the joke, they get a stats concept.


*Aside: I know I could have embedded these Tweets, but I decided to make my life easier by using screenshots.


How to use in class? If your students get the joke, they get a stats concept.


*Aside: I know I could have embedded these Tweets, but I decided to make my life easier by using screenshots.


 |
| How NOT to write a response option. |

 |
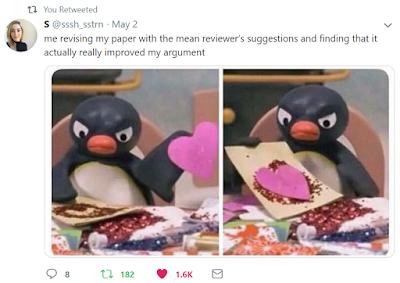
| Real life inter-rater reliability |
 |
| Scale Development |


Alright, technically not Twitter, but I am thrilled to make an exception for this clever, clever costume:


 |
| This whole thread is awesome...https://twitter.com/EmpiricalDave/status/1067941351478710272 |


 |
| Randomness is tricky! And not random! |


 |
| Click through to see the wonderful video!! https://twitter.com/kareem_carr/status/1169249892386185216 |
 |
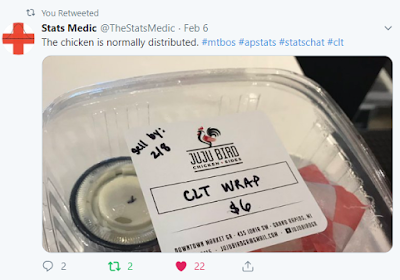
| mean, median, measures of central tendency |
 |
| significance, power |
 |
| Bayes Theorem |
 |
| graphs and charts, Halloween |
 |
| quantitative, qualitative |
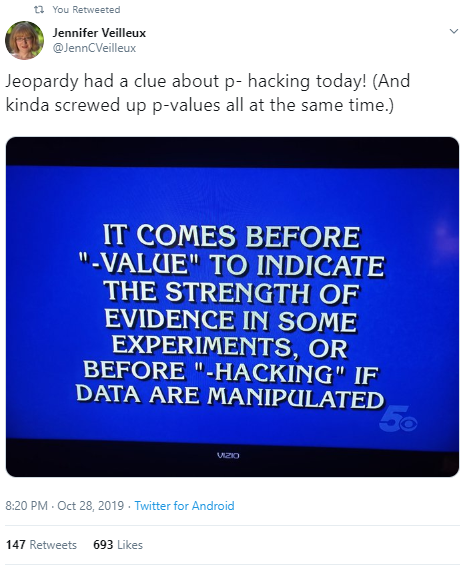 |
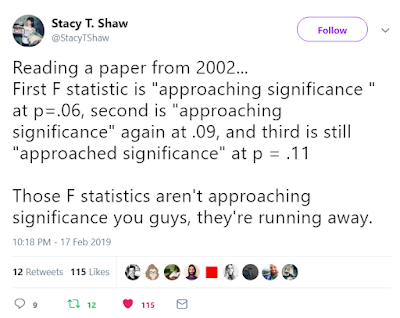
| p-values in real life |
 |
| GLM for the win |
 |
| Excel, data formatting |
 |
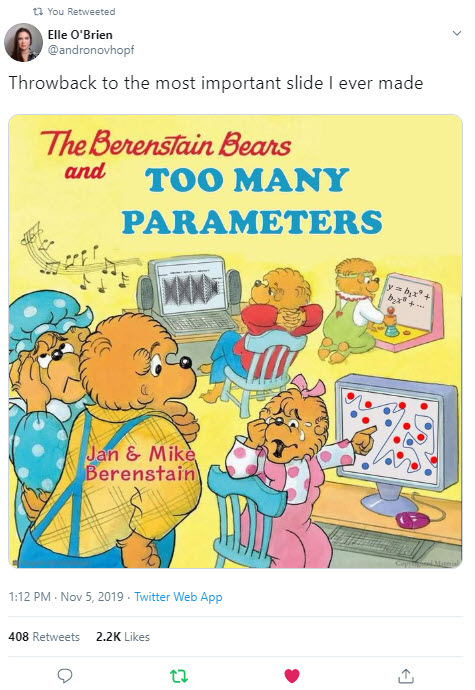
| multi-collinearity |
 |
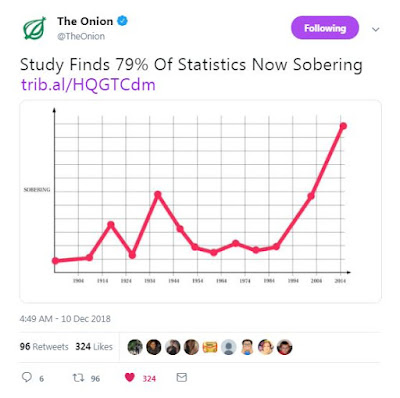
skew  |


Well powered replication. https://t.co/y9qHgmTWg5— 🐙🛐 Will Gervais 🛐🐙 (@wgervais) January 20, 2020
My daughter loved the @FryRsquared Christmas Lectures so much she made this Lego Statistics Animation https://t.co/Q3X2FUYS2m pic.twitter.com/caavfR8ESD
— Caroline Lear (@CarolineLear) May 15, 2020
 |
| https://twitter.com/rlmcelreath/status/1280106715195650048 |

 |
| https://www.smbc-comics.com/comic/the-data |


P=0.049 pic.twitter.com/o6HCNgmMeM
— Pradeep Natarajan (@pnatarajanmd) September 20, 2020


This is how geologists collect lava samples from active volcano 🔥 pic.twitter.com/lRU24NhxFc
— Nature And Animals 🌿 (@animal0lovers) November 19, 2020


 |
| https://twitter.com/jkrillustration/status/1329180198772887555 |

Estimating a Parameter from a Random Sample pic.twitter.com/H2KxnLzDyH
— Chelsea Parlett-Pelleriti (@ChelseaParlett) December 15, 2020
An example of why statisticians need to standardize data? 😆 https://t.co/EIJ9dGid0k
— Dr. Jess Hartnett 📊 (@Notawful) December 14, 2020


