
A simple tool operationalizes post-childbirth hemorrhaging and saves lives.

 https://www.npr.org/sections/goatsandsoda/2023/05/10/1175303067/a-plastic-sheet-with-a-pouch-could-be-a-game-changer-for-maternal-mortality

https://www.bmj.com/content/381/bmj.p1055

I love this study, in and of itself, because it is based on research that will save women's lives without spending a lot of money. I love it. 

Headline from the original research, reading, "Simple intervention for severe blood loss after childbirth is found to save lives."


Here is a link to the original study. I learned about it from an NPR story about the research by Rhitu Chaterjee.

I also love it because it is an accessible example of a bunch of statistics things: Dependent variables...operationalizing variables...why cross-cultural research and solutions aren't just lip service to diversity...how control groups in medical research are very different than control groups in psychology research...absolute vs. relative risk.

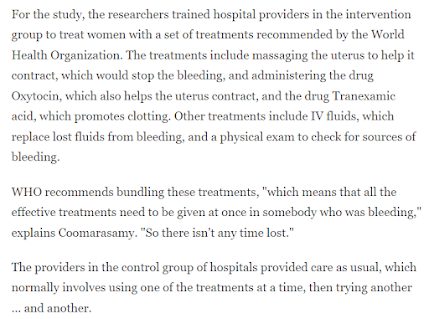
-Dependent variables/operationalized variables: This study clearly illustrates the power of measurement and operationalization. The researchers wanted to create a way to better assess post-childbirth hemorrhaging. Medical professionals created a plastic drape to correctly measure blood loss after pregnancy. The blood loss pools in a plastic pouch, which is far easier to measure than an estimate of blood lost based on blood on the floor, gurney, etc. 


https://www.researchgate.net/figure/Photograph-of-the-calibrated-blood-collection-drape_fig1_281634929

-Cross-cultural research is essential. An intervention that works in one part of the world may or may not work in other parts of the world. Innovations can come from parts of the world that may be under-represented in medical journals. Previous research about the drape has occurred in Thailand and India

-Control group =/= The Nothing Happens Group. In psychology research, the control group usually means nothing is happening. Placebo. However, that is different from what a control group is in medical research. As in many medical research studies, the control group received standard care plus the experimental condition.

For the study, the researchers trained hospital providers in the intervention group to treat women with a set of treatments recommended by the World Health Organization. The treatments include massaging the uterus to help it contract, which would stop the bleeding, and administering the drug Oxytocin, which also helps the uterus contract, and the drug Tranexamic acid, which promotes clotting. Other treatments include IV fluids, which replace lost fluids from bleeding, and a physical exam to check for sources of bleeding.  WHO recommends bundling these treatments, "which means that all the effective treatments need to be given at once in somebody who was bleeding," explains Coomarasamy. "So there isn't any time lost."  The providers in the control group of hospitals provided care as usual, which normally involves using one of the treatments at a time, then trying another ... and another.
A description of the control group used in this study.


Absolute vs. Relative Risk: I believe absolute vs. relative risk is the most critical probability lesson we can teach in introduction to psychology. This is an excellent example of this.


An example of absolute v. relative risk that isn't shady. This first paragraph describes the findings in terms of relative risk.

A more precise measurement of blood loss with a 'drape' The study, carried out in 80 hospitals across four African countries, used a simple device called a "drape" to collect and measure the amount of blood from women who have just given birth. The device, combined with a bundle of treatment options recommended by the World Health Organization, reduced the number of women experiencing severe bleeding by 60%. The study also found a reduction in maternal deaths from bleeding.


The same summary also describes the findings in absolute risk.


Also, the interview with the author touches on how research can 1) help explain some but not all of the variance explained, 2) ecological validity, and 3) how real-life interventions are evaluated not just by efficacy/data but by cost and ease of implementation. 


Comments

Popular posts from this blog

Ways to use funny meme scales in your stats classes

Have you ever heard of the theory that there are multiple people worldwide thinking about the same novel thing at the same time? It is the multiple discovery hypothesis of invention . Like, multiple great minds around the world were working on calculus at the same time. Well, I think a bunch of super-duper psychology professors were all thinking about scale memes and pedagogy at the same time. Clearly, this is just as impressive as calculus. Who were some of these great minds? 1) Dr.  Molly Metz maintains a curated list of hilarious "How you doing?" scales.  2) Dr. Esther Lindenström posted about using these scales as student check-ins. 3) I was working on a blog post about using such scales to teach the basics of variables.  So, I decided to create a post about three ways to use these scales in your stats classes:  1) Teaching the basics of variables. 2) Nominal vs. ordinal scales.  3) Daily check-in with your students.  1. Teach your students the basics...

Using pulse rates to determine the scariest of scary movies

  The Science of Scare project, conducted by MoneySuperMarket.com, recorded heart rates in participants watching fifty horror movies to determine the scariest of scary movies. Below is a screenshot of the original variables and data for 12 of the 50 movies provided by MoneySuperMarket.com: https://www.moneysupermarket.com/broadband/features/science-of-scare/ https://www.moneysupermarket.com/broadband/features/science-of-scare/ Here is my version of the data in Excel format . It includes the original data plus four additional columns (so you can run more analyses on the data): -Year of Release -Rotten Tomato rating -Does this movie have a sequel (yes or no)? -Is this movie a sequel (yes or no)? Here are some ways you could use this in class: 1. Correlation : Rotten Tomato rating does not correlate with the overall scare score ( r = 0.13, p = 0.36).   2. Within-subject research design : Baseline, average, and maximum heart rates are reported for each film.   3. ...

Andy Field's Statistics Hell

Andy Field is a psychologist, statistician, and author. He created a funny, Dante's Inferno-themed  web site that contains everything you ever wanted to know about statistics. I know, I know, you're thinking, "Not another Dante's Inferno themed statistics web site!". But give this one a try. Property of Andy Field. I certainly can't take credit for this. Some highlights: 1) The aesthetic is priceless. For example, his intermediate statistics page begins with the introduction, "You will experience the bowel-evacuating effect of multiple regression, the bone-splintering power of ANOVA and the nose-hair pulling torment of factor analysis. Can you cope: I think not, mortal filth. Be warned, your brain will be placed in a jar of cerebral fluid and I will toy with it at my leisure." 2) It is all free. Including worksheets, data, etc. How amazing and generous. And, if you are feeling generous and feel the need to compensate him for the website, ...