
I love InformationIsBeautiful. They created my favorite data visualization of all time.
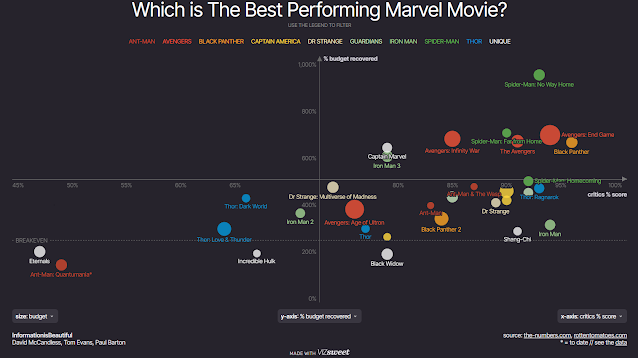
They also created an interactive scatterplot with all sorts of information about Marvel Comic Universe films.
How to use in class:
1. Experiment with the outcome variables you can add to the X and Y axes: Critical response, budget, box office receipts, year of release, etc. There are more than that; you can add them to either the X or Y axes. So, it is one website, but there are many ways to assess the various films.
2. Because of interactive axes, there are various correlation and regression examples. And these visualizations aren't just available as a quick visual example of linear relationships...see item 3...
3. You can ask your students to conduct the actual data analyses you can visualize because the hecking data is available.
4. The website offers exciting analyses, encouraging your students to think critically about what the data tells them.

5. You could also squeeze Simpson's Paradox example from this data. Sure, you can view the overall trends when you look at all of the movies simultaneously (like the first scatterplot in this blog post). However, you can also look at individual franchises and see differences in performance, like Avengers movies vs. Thor movies (see below).

