
Want to avoid federal regulation and increase profits? Just don't share your data.

TL;DR:

One way to avoid government regulation is by simply refusing to share data that may lead to government regulation (and safer trains). I'm looking at you, railroads.

_____________________________________________________________________________

Not every example I post syncs directly to the typical Psychological Statistics curriculum.

I also post about statistical literacy. Like why data matters and counts. And how very, very simple data could help illuminate and solve real-world problems, but only if we can access that data.

I get good and mad at organizations that avoid responsibility by manipulating and/or withholding data. 

See: Organizations that share data but in a functionally inaccessible way. Also, I created a spreadsheet (of course I did) containing several examples of times when large organizations goofed around with data so they wouldn't get sued. It looks like I should add rail roads to this list.

Aside: I grew up not 10 miles from the world-famous Horseshoe Curve. This also means that I grew up in a city that had a railroad running through it (Hollidaysburg, PA), went to graduate school in a town with a railroad running through the middle of it (DeKalb, IL), and currently live in a city with a railroad track that runs through the middle (Erie, PA).


The world-famous Horseshoe Curve, y'all.


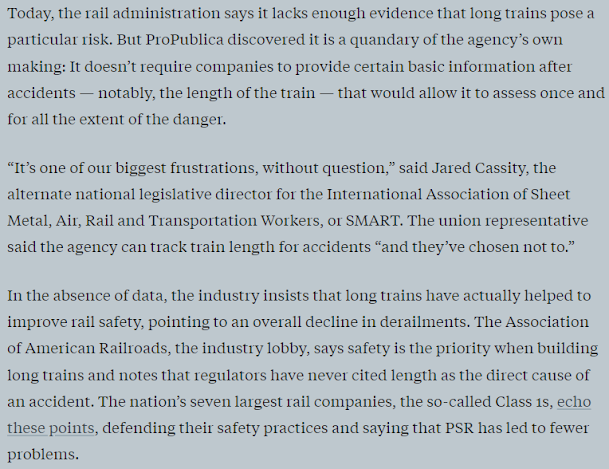
I am proud of my hometown's railroading history. And pretty mad that railroads have made trains longer and longer over time but aren't compelled to report the length of trains when they are involved in accidents. Since the regulatory bodies don't have the data, they can't determine if long trains are causing accidents.

For a brief audio summary of this issue, here is the NPR interview with ProPublica's Dan Schwartz.

Check out Schwartz's report at ProPublica for a deep dive into this topic. Below, I included some screenshots from the ProPublica piece, but you should see the ProPublica piece itself. It contains lots of good graphics and more details about specific train accidents and the lives they have changed.

Schwartz highlights that there are ample reasons to believe that longer trains lead to more accidents. Trains and rails were not designed with super-long trains in mind. It seems reasonable to think that longer trains are problematic because of physics. Bigger things take longer to slow down. Railroad tracks and safety features were not designed with long trains in mind.

The hulking trains could generate forces powerful enough to break the heavy-duty materials their cars were made of. In March 2008, the rear end of a 1.5-mile-long BNSF train ran forward as the front of the train decelerated, sandwiching the train and cracking an old repair on a tanker car. The train broke in two in Minnesota, dumping 20,000 gallons of ethylene glycol, commonly used in antifreeze, into a tributary of the Mississippi River.  And long trains that were assembled with too much weight in the rear and too little up front were hurtling out of control and jumping off of tracks. It happened in Virginia in 2006, in Wisconsin in 2015 and in Iowa in May 2017. Short trains can derail in the same way, but experts say longer trains can cause more damage when they fling dozens of cars and their contents through neighborhoods.

But regulatory agencies can't prove it BECAUSE THEY DO NOT DEMAND THAT SPECIFIC DATA POINT WHEN INVESTIGATING TRAIN ACCIDENTS.

Text from Propublica: Today, the rail administration says it lacks enough evidence that long trains pose a particular risk. But ProPublica discovered it is a quandary of the agency’s own making: It doesn’t require companies to provide certain basic information after accidents — notably, the length of the train — that would allow it to assess once and for all the extent of the danger.  “It’s one of our biggest frustrations, without question,” said Jared Cassity, the alternate national legislative director for the International Association of Sheet Metal, Air, Rail and Transportation Workers, or SMART. The union representative said the agency can track train length for accidents “and they’ve chosen not to.”  In the absence of data, the industry insists that long trains have actually helped to improve rail safety, pointing to an overall decline in derailments. The Association of American Railroads, the industry lobby, says safety is the priority when building long trains and notes that regulators have never cited length as the direct cause of an accident. The nation’s seven largest rail companies, the so-called Class 1s, echo these points, defending their safety practices and saying that PSR has led to fewer problems.
https://www.propublica.org/article/train-derailment-long-trains

Go to the original article. He explains the rise of the extra-long trains and how they have increased railroad profits. 

Like. It is one column in a spreadsheet. Just one data point, the length of the train. 

It was only after all of this happened that the FRA, in March 2018, replied to the union officials who had expressed concerns that previous spring. In a letter, the agency said it “began looking at the length of trains as a potential contributing cause of FRA reportable accidents/incidents” in 2016. The agency still did not have “the sufficient data or evidence to justify an Emergency Order limiting the length of trains.”  In May 2019, the GAO completed its study, coming to a similar conclusion: long trains may be dangerous, but more information was needed. Its effort was partly stymied, the GAO said, because most rail companies refused to hand over enough of their private train-length data to allow investigators to make findings. The FRA also told ProPublica it has asked companies for this data but never gotten it.  On Thursday, the FRA told ProPublica it is starting the process of requiring companies to disclose the train length for every reportable accident, a move prompted by the Infrastructure Investment and Jobs Act. But there is no guarantee the regulators will succeed. The FRA said it first needs to publish a notice of the new data-collection effort and ultimately the Office of Management and Budget would need to approve the measure.


Aside: ProPublica is a favorite of mine! Check out these past blog posts featuring their reporting...

Comments

Popular posts from this blog

Ways to use funny meme scales in your stats classes

Have you ever heard of the theory that there are multiple people worldwide thinking about the same novel thing at the same time? It is the multiple discovery hypothesis of invention . Like, multiple great minds around the world were working on calculus at the same time. Well, I think a bunch of super-duper psychology professors were all thinking about scale memes and pedagogy at the same time. Clearly, this is just as impressive as calculus. Who were some of these great minds? 1) Dr.  Molly Metz maintains a curated list of hilarious "How you doing?" scales.  2) Dr. Esther Lindenström posted about using these scales as student check-ins. 3) I was working on a blog post about using such scales to teach the basics of variables.  So, I decided to create a post about three ways to use these scales in your stats classes:  1) Teaching the basics of variables. 2) Nominal vs. ordinal scales.  3) Daily check-in with your students.  1. Teach your students the basics...

Leo DiCaprio Romantic Age Gap Data: UPDATE

Does anyone else teach correlation and regression together at the end of the semester? Here is a treat for you: Updated data on Leonardo DiCaprio, his age, and his romantic partner's age when they started dating. A few years ago, there was a dust-up when a clever Redditor r/TrustLittleBrother realized that DiCaprio had never dated anyone over 25. I blogged about this when it happened. But the old data was from 2022. Inspired by this sleuthing,  I created a wee data set, including up-to-date information on his current relationship with Vittoria Ceretti, so your students can suss out the patterns that exist in this data.

If your students get the joke, they get statistics.

Gleaned from multiple sources (FB, Pinterest, Twitter, none of these belong to me, etc.). Remember, if your students can explain why a stats funny is funny, they are demonstrating statistical knowledge. I like to ask students to explain the humor in such examples for extra credit points (see below for an example from my FA14 final exam). Using xkcd.com for bonus points/assessing if students understand that correlation =/= causation What are the numerical thresholds for probability?  How does this refer to alpha? What type of error is being described, Type I or Type II? What measure of central tendency is being described? Dilbert: http://search.dilbert.com/comic/Kill%20Anyone Sampling, CLT http://foulmouthedbaker.com/2013/10/03/graphs-belong-on-cakes/ Because control vs. sample, standard deviations, normal curves. Also,"skewed" pun. If you go to the original website , the story behind this cakes has to do w...